Hello, everyone!
It’s been a busy start to the week here at the Data School as per usual. With Andy gone for the week, we’ve had a number of additional data masters come in to teach us some more Tableau and Alteryx magic. Today, Carl Allchin gave us a wonderful lecture on two of Tableau’s most powerful tools: Table calculations and Calculated Fields. From sneaky little features to nested calculations, here is a list of four tips I found the most useful and, well, just plain awesome. Let’s dig right in!
How do you build a calculated field?
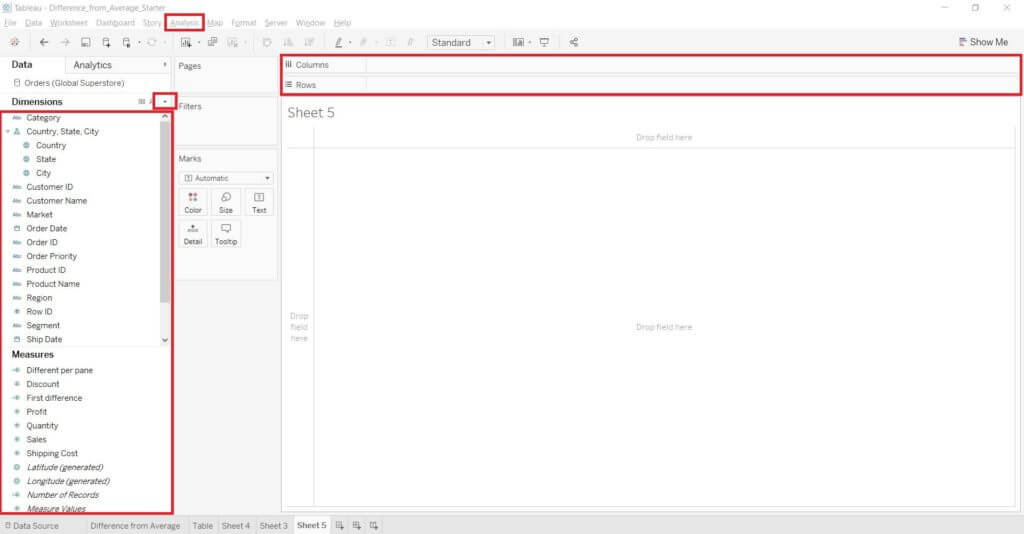
There is a ridiculous number of different ways you can use to add a calculated field – by ridiculous I mean 8. Here is a list of the ones I found the most useful, and a screenshot to make things as clear as possible.
- My personal favorite is the little upside-down carrot icon located to the right of Dimensions on the data pane. It’s easy to find and can also be used to build parameters,
- You can right-click anywhere on the Data Pane (the big box on the left of the picture),
- You can right-click or double-click anywhere in the Column and Rows shelves. If you have a measure or dimension in the shelf, you can also right-click or double-click them directly to edit them directly.
- The Analysis tab in the top bar also provides you with the Create calculated field option in its menu. Why did I mention this apparently obscure method of creating calculated field? Scroll down to find out why!
How can you find all your calculated fields in two clicks?
You’ve just created yet another calculated field after trying to get a formula just right. You quickly glance somewhere else, check some other values, and the moment you want to bring in that new calculation, you realize you have no idea what you’ve just called it. You scroll through your dozens of rows and measures, unable to recall if it was “Table Calc1”, “Table Calc 1”, “Calculation 1”, etc, etc.
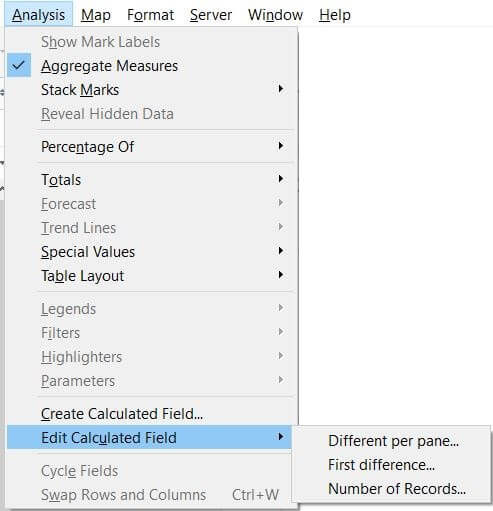
Fear not! There is an amazingly simple way to find all your table calculations straight away. Just head over to the Analysis tab in the top menu, scroll down to Edit Calculated Field, and boom! You’ll find the full list of your calculated fields so you can easily find the one you were working on, or edit them directly.
What does Compute using Table (Across) or Table (Down) even mean?
You’ve just built yourself a beautiful chart showing profit data for your company, and you chose to add a Quick Table Calculation. You hit the little carrot on the Profit pill, go down to the table calculation menu, and select a running total. After patting yourself on the back for accomplishing this feat, you suddenly realize that your values aren’t right. It seems tableau isn’t adding your profit values the way you had intended.
Don’t worry, Tableau has a neat tool that you can use to easily change the way it runs these table calculations. Hit the carrot (the upside down triangle) on the table calculation’s pill, and scroll down to Compute Using. It looks like this:
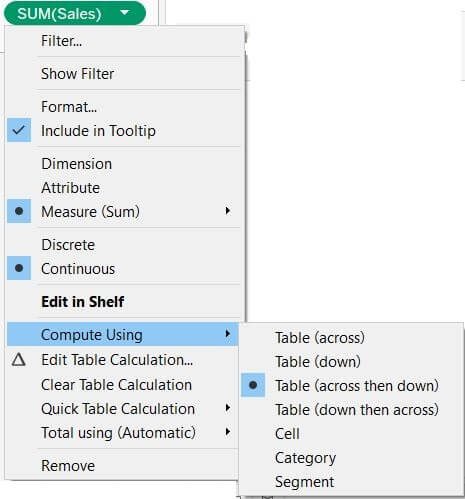
As you can see, Tableau gives you the option to directly switch the way it is “running” the calculation. This is an easy way to quickly get the result you initially wanted. A little confused by what these options mean? Well, let’s delve a little bit deeper into that, with our running total example in mind:
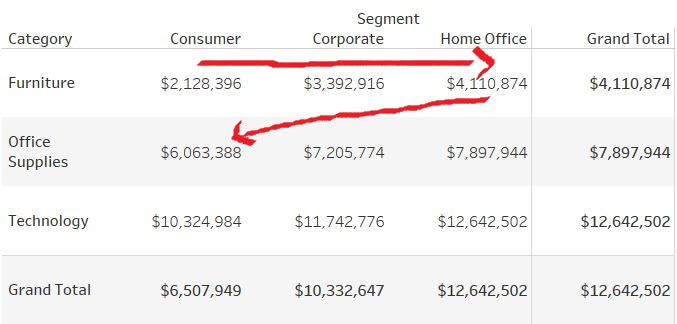
- Table (across) is telling Tableau to sum the values per row and to start over with each new row. As you can see in the screenshot below, Tableau is adding up the values for each Segment (Consumer, Corporate, Home Office) for the Furniture category, then start over for Office supplies, and keep going until it reaches the last row.

- If you select Table (Across then Down), Tableau will sum the values for each row, and then add them to the first value on the next row, sum up all the values on that row, and keep going until the end of the table. As you can see in the example below, the calculation is computing the running total for each value on the first row, Furniture, and then adds that to the first value in the Office Supplies row, Consumer. It keeps going until it has reached the end of the table.
If you are building complicated graphs and are getting confused as to how you should configure your calculation, you can always build a simple table like the ones I’ve just shown you to figure out how the calculation is being computer and adapting your setting to what you need!
Table Calculation-ception
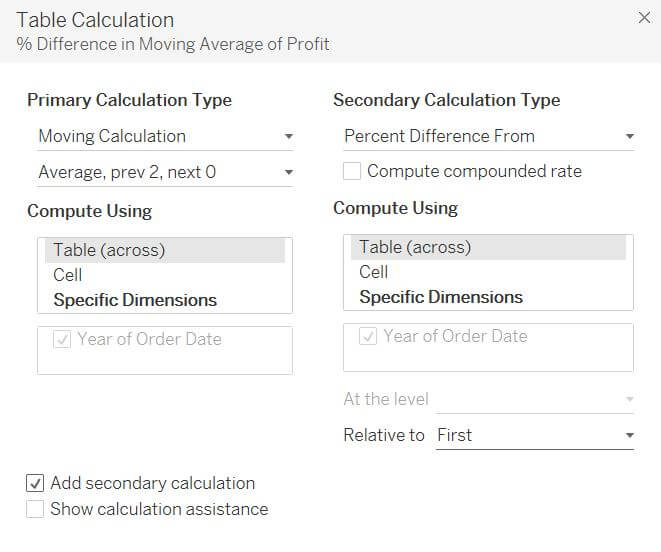
This tip is by far the one with the highest geek value I will share with you today. Say you’ve just calculated the Moving Average or Running Total of your profit data, but you realize you’d actually want to calculate the Percent Difference since your first year of data to get a better idea of your firm’s current performance. Tableau’s magic will make doing this ridiculously easy, thanks to nested table calculations.
As long as your first table calculation is a Moving Average or Running Total – you can only build a second calculation on top of one of these – Tableau will give you the option to add a second table calculation. You just have to hit Edit Table Calculation on your table calculation’s pill and check the Add secondary calculation at the bottom. As you can see here, I’ve chosen to add a Percent Different From.
I hope you guys will benefit from Carl’s tips as much as I have. Tune in next time for more Tableau/Alteryx goodness!
