Put your MATLAB models and algorithms to work in Tableau


With the Tableau MATLAB integration, you can take advantage of your models published on MATLAB Production Server inside Tableau calculated fields, passing data from your dashboards in real time to get predictive insights—with all the performance and scalability benefits of an enterprise-grade compute infrastructure.
MATLAB combines a high-level language that enables you to perform computationally intensive tasks in an authoring environment built for engineers and data scientists. Because of its variety of capabilities for developing algorithms and predictive models (from statistics and optimization to machine learning), MATLAB has many applications: signal and image processing, communications, control design, test and measurement, financial modeling, and computational biology.
Configure your integration
Configuring Tableau to use MATLAB is no different than Python and R connection experiences. Simply enter the server name and port for your MATLAB connection, and you’re good to go.
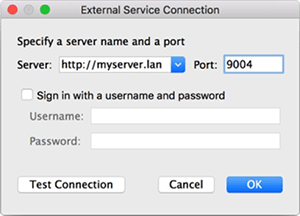
Find this dialog at Help > Settings and Performance > Manage External Service Connection.
How to leverage MATLAB in Tableau
Optimization of delivery routes is a very common application of advanced analytics in industries like shipping and manufacturing. MATLAB offers many different methods to achieve such tasks from linear programming to genetic algorithms. All you need to do is to write your MATLAB code as usual and deploy it to MATLAB Production Server.
Want to find the best path to travel between a set of airfields? In Tableau, just call out to that MATLAB model from your SCRIPT_ calculations and pass the necessary arguments as an ordered list. In this example, MATLAB code expects a table with two columns of data in Longitude, Latitude column order:
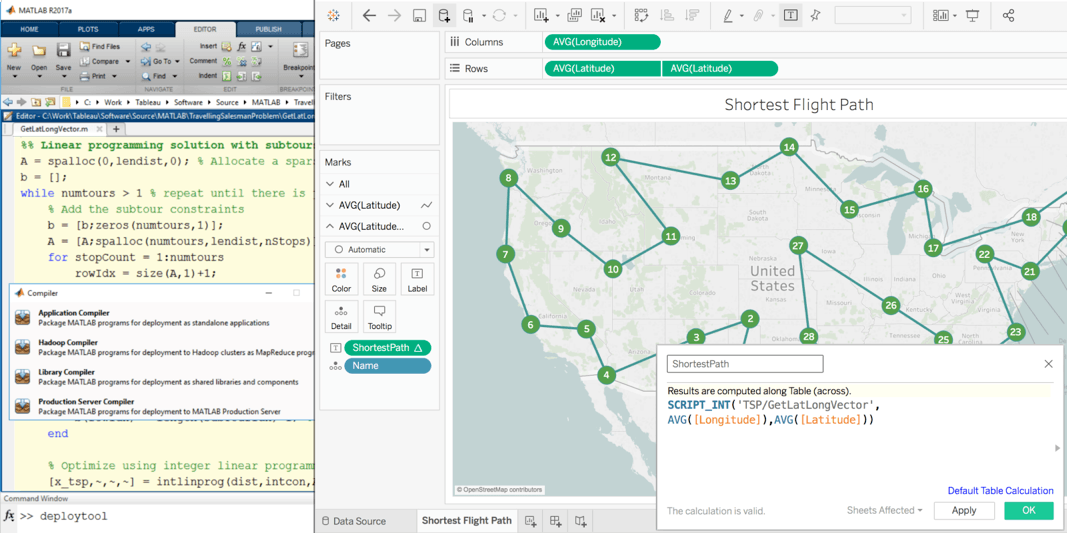
As you interact with the resulting visualization, you will notice that the view responds to your changes. For example, you can lasso some airports and exclude them to see recommended paths update in real time.
While we’re at it, how about exploring different investment strategies?
Portfolio optimization is commonly used by finance professionals to make investment decisions across a collection of assets such as stocks and bonds. The goal is to optimize the risk versus return of the set of investments. MATLAB provides a variety of capabilities to analyze financial data and to develop models for optimizing your financial portfolios.
Below you see percent change in daily market closing data over a 10-year period for S&P 500, Nikkei 225, TSX Composite, CAC 40, DAX, and FTSE 100 indices from the U.S., Japan, Canada, France, Germany, and the UK respectively. If you wanted to invest, given historical patterns, what would an ideal portfolio look like to increase return while reducing the risk?
MATLAB’s Financial Toolbox has all the tools you need for this question. By building and interacting with the view in Tableau, you can easily run your analysis on different periods of data or sets of markets, and get immediate results.
Together, Tableau and MATLAB enable many more advanced analytics scenarios from deep learning to predictive maintenance, making your dashboards even more impactful. For information on how to configure your MATLAB server to work with Tableau, please contact EISupport_Tableau@mathworks.com or consult the Pass Expressions to External Services guide on Tableau OnlineHelp.
Learn more about data science integrations in Tableau
Related Stories

Who is Einstein Copilot for Tableau for?
 April 10, 2024

Securely Access and Analyze All of Your Data with Data Connect for Tableau Cloud

Tableau Prep Conductor Supports Custom Schedules
 March 15, 2024
Subscribe to our blog
Get the latest Tableau updates in your inbox.